

We love a good HubSpot hack, especially when it revolves around cleaning up bad data!
So you can imagine how excited we were when Gem Rugg-Dunn from HubSpot partner BabelQuest shared a little insight into how she builds out a data cleanse dashboard.
Taking this idea and running with it, we’ve now created our own version and provided a quick tutorial for you to follow so that you can create your very own data cleanse dashboard to sweep away those outdated records, pesky unsubscribes and potential gaps in your database.
Every business is unique, so you’ll really want to customise this to fit your needs. We'd be happy to help you get started if you're not sure!
How to build your own data cleanse dashboard: step-by-step
- Within your HubSpot portal, head to Reports > Dashboards
- Select Create dashboard > Blank Dashboard and give it a name e.g. ‘Data Hygiene Dashboard’
- Set the necessary permissions to determine who can access the dashboard
- Select Create dashboard
- Begin creating your reports by pressing Add report > Build a new report
- Select Single object
- Select the object you want to report on (as standard, most reports will only use the Contact or Companies objects)
- Once you’ve chosen your chart type, properties and filters select Save
- Give your report a practical name then select Add to the existing dashboard (choosing your newly created Data Hygiene Dashboard)
- Select Save & add
- On the Dashboard, you can adjust the dimensions of the embedded report by manoeuvring the bottom right corner
Some example reports you could include...
So you might not be entirely sure what you want to include in your data cleanse dashboard. Every business is unique and there'll be types of data you hold, whether it's a custom object or specific property that's important to your aims, that you'll likely want to have a view of that's not included here.
But these top 10 most common reports can give you a good head start...
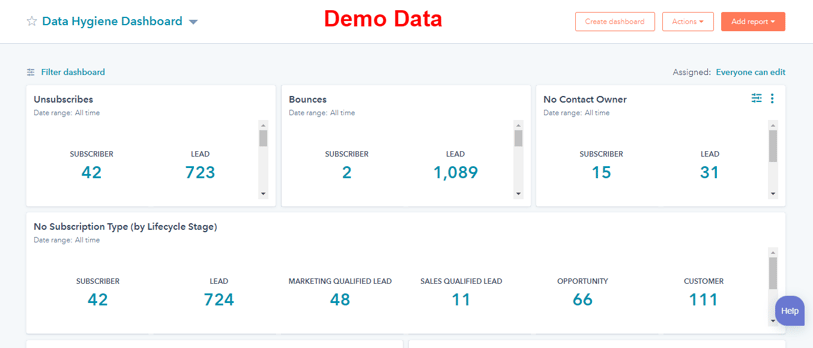
- Total number of Unsubscribes (contact object | summary chart type)
- Total number of Bounces (contact object | summary chart type)
- Total number of No Contact Owners (contact object | summary chart type)
- No subscription type by Lifecycle Stage (contact object | summary chart type)
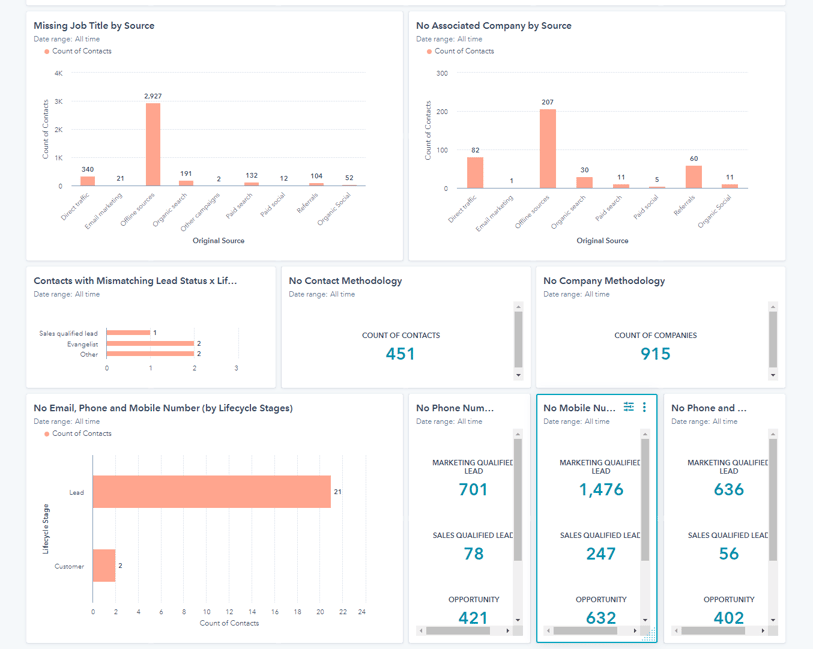
- Contacts with Mismatching Lead Status x Lifecycle Stage (contact object | bar chart type)
- Contact Created Compared to Last Year (contact object | area chart type)
- No Associated Company by Source (company object | column chart type)
- Contacts by Country (contact object | bar chart type)
- Missing Job Title by Source (contact object | column chart type)
- No First Name (contact object | summary chart type)
Top Tip: For maximum efficiency and to help you keep on top of your data hygiene, you can set up an automated email to deliver a copy of this dashboard from HubSpot each week/month!
Take a look at this demo dashboard we've built below for some additional examples of more specific reports:
Header image source: Unsplash